Some background info
As I may or may not explain on some other post, some other day, I run my home lab on hardware that’s well past the “obsolete” stage and marching full speed towards becoming “vintage”.
Said lab, hosts all sorts of little services, private and public, including this here, marvellous website as well as a docker instance of BrickSync, a great little piece of software that keeps our BrickOwl and BrickLink stores in sync.
On a routine search for my lost disk space, I (re)discovered that BrickSync spits out a snapshot of the store inventory in XML format every time an update was triggered. Either by an order or by me. It also saves a copy of every order in XML format.
All in all, I discovered over 20 GB worth of XML files that contain a nearly full history of my store. A short python time later and I had a POC that could walk through all the files and dump all the data. Now what?
The failed attempt
A little voice in the back of my head had been shouting Elastic, which I hadn’t used before. A chat with a friend confirmed the idea. A ton of little files, ingested and turned into useful, searchable information. Exactly the task Elastic was made for.
So, off I went to set up a stack on my poor little home lab. That’s when I was reminded that Elastic is meant to run on proper server hardware. I kept adding memory, trying to get it to do something useful, and I eventually got to that point with 4 GB of ram.
Yes, it run and yes, it looked like it was doing something but not much and not fast. Compared to everything else on that server, its footprint looked like Bigfoot was stepped on by a dinosaur, and the spatter was causing OOM kills among the rest of the services.
Back to the drawing board
Then I thought my data is already very structured. Do I really get much benefit from using Elastic? How about pushing the data in some database, MariaDB being the prime candidate, and then treating it like the time series it is, maybe using Prometheus and Grafana.
While researching the subject, the Postgres name kept popping up and I decided to give it a shot. I have a couple of instances running but never developed for it. A quick setup and a quick update to the python scripts and data was loading in the background while I continued researching the Prometheus – Grafana setup.
As it turns out, Prometheus is itself a database. A Time Series Database to be precise and as it turns out, Postgres also has a time series extension, TimescaleDB. The things you find out if you RTFM first…
By this point, I already had nearly 50 million records imported and I had already discovered that Grafana can actually pick up data directly from Postgres. I decided to skip the completely unfamiliar to me, Prometheus step, and leave that lesson for another day.
My thought process in roughly this order:
- This is SQL. I know this!
- The Grafana query builder is a bit of a pain. I’ll create views in Postgres.
- These views are kinda slow. Since I don’t have real time data to worry about, I could cache the view results into a table…
- Hey look! Materialised views!
Where were those when I was young? That’s similar to the SQL Server Indexed Views, right? Is that where the idea of cached views came from? This brain could do with some defragmenting and re-indexing…
What did we achieve?
What a fantastic thing those materialised views! Aggregate 50 million rows in 2, 3, 4 different ways, base your queries on those and get sub-second responses!
Refreshing these views takes a few minutes on this beast of a system, but new data is only available a few times a day so daily updates are more than enough. Those will probably be scheduled to run during the night.
The current setup consists for one Postgres and one Grafana instance, each allowed 512MB of ram. I can get the Grafana container killed if I open a bunch of pages back to back but I have not yet seen the Postgres container die.
What’s next?
The TimescaleDB extension might still come in handy. Incremental updates to the materialised views, time buckets and alleged space savings with columnar storage compression are definitely worth checking out.
For the front end, something lighter than Grafana might be worth exploring. At the moment it feels like I’m using a sledge hammer to present data straight out of views. Maybe something based on Apache ECharts would be enough. A project for when we need to recover server resources.
Why?
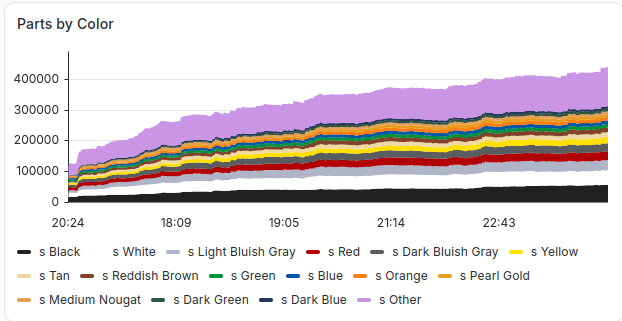
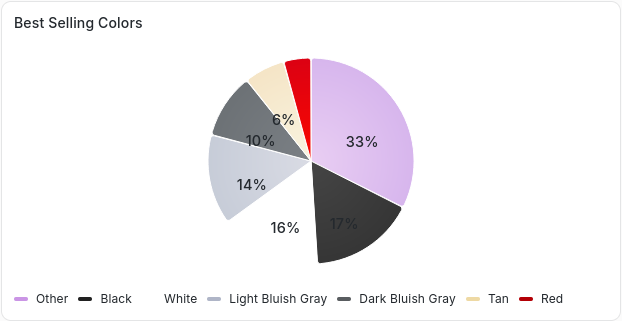
So what does it do? Well it does exactly what it was meant to do. It provides very clear and valuable insights into the inner workings of an AFOL’s mind. It also highlights other mysteries of the lego world.
How, for example, when black, white and grey parts only make up a quarter of the store stock, they account for over half of the sales. Or how when over half of the sales are of black, white and grey parts, all the things that people build and share are so colourful…
It does more and it can do even more. My next challenge is to determine what other data can be extracted and visualised, and more importantly, find out in what way is it of any value.
In any case, finally getting to play with Postgres in a non-superficial way is a win in itself. It seems to have a very slightly larger idle footprint than MariaDB and it has been a very well behaved tenant on this limited server so far.
Materialised views were a very nice, unexpected little surprise. Apparently Postgres has a full meme worth of such features waiting to be explored. Can’t wait!