Quite some time ago, I started noticing random websites failing to load at random times. No real pattern to it. No obvious reason but also no lasting effects. Refresh a few minutes later and everything was back to normal.
My browser? My network? Their network? All the new fancy cloud related technologies? Asynchronous microservices, serverless functions, NoSQL databases, ephemeral instances and everything else that happens when IT people decide to bring their commitment issues to work…
There certainly were enough new technologies appearing. Too much scrumminess and agility up in the air. Way too much continuous integration, all the way to the back of the developer’s envelope. Teething trouble I thought…
Looking at Firefox’s Network Monitor (Ctrl+Shift+E), the main culprits back then were fonts from fonts.googleapis.com and javascripts from one of the gstatic.com domains. Great! The undercover tracking “cookies” were now causing random sites to fail when unavailable. I blamed it on failing CDNs at the time and moved on as the problem gradually went away by itself.
I may be connecting dots that were never there but some time later, google services would stop responding at times and I assumed the issue was back. Google search, google chat and youtube, all would randomly just stop working.
The troubleshooting equations started with time and service as parameters. User, device and program were added very soon after. It started with the classic “works for me” responses and escalated to Cluedo style reports. “Google, on the laptop, with Edge is broken again.”
Down the wrong rabbit hole
I misinterpreted my trusty Firefox Network Monitor, which showed NS_BINDING_ABORTED errors. Those happen when the user is too impatient and clicks all over the place. Instead I assumed that the NS part meant DNS issues because of course, it’s always DNS.
Was it Pi-hole? Was the Pi 2B finally dying? Or the 10 year old SD card? Is the latest version finally reaching the hardware limits? Am I even running the latest version?
So many questions, one simple way to answer them all. Set up an instance in a Proxmox CT, sit back and wait. Did I mention that this process involved A LOT of waiting? The beauty of intermittent problems…
Well, that didn’t fix it. I very briefly tried running without an ad blocker but that was not an acceptable option, especially not for a long waiting test. I tried AdGuard Home but that didn’t fix it either.
I tried both Pi-hole and AdGuard with a combination of upstream DNS servers (ISP, google, quad9) as well as a local Unbound instance. Nothing made any difference. combinations returned the same results to the client so I went back to Pi-hole on the Pi 2B.
At least I ended up with an upgrade to Trixie and valid repositories again. I also kept the Unbound instance, running on the same Pi, because why not add yet another potential point of failure in the chain.
I was starting to suspect that this time it may actually not be DNS. I don’t know if that has ever happened before but I’m pre-emptively gonna claim first!
It was around this time that I also started paying attention to the fact that NS_BINDING_ABORTED is not a DNS related issue.
A more systematic approach
One of the biggest pains in troubleshooting this, was that by the time I noticed, the time it took me to get annoyed and the time I tried to investigate, I only ever got a few minutes before the problem disappeared.
I somehow realised that a simple ping was not a representative test to check connectivity to www.google.com. Ping (the program) selects one of the 8 IP addresses at random. So do all other programs, and if they don’t, DNS seems to return the results in random (maybe round-robin?) order.
Did I mention that www.google.com has 8 A records? So does www.youtube.com. Some sort of redundancy I guess and a natural, external load balancer…
dig www.google.com
...
;; ANSWER SECTION:
www.google.com. 706 IN A 142.251.150.119
www.google.com. 706 IN A 142.251.155.119
www.google.com. 706 IN A 142.251.156.119
www.google.com. 706 IN A 142.251.157.119
www.google.com. 706 IN A 142.251.153.119
www.google.com. 706 IN A 142.251.154.119
www.google.com. 706 IN A 142.251.151.119
www.google.com. 706 IN A 142.251.152.119
I soon was able to confirm that whenever I was having trouble with a service, at least one of the IP addresses was not reachable. No ICMP responses, no traceroute, no response to an http request nothing.
I needed a way to check this without having to very quickly type ping commands and it would certainly help to keep track of when it happens, how often and how long it lasts.
Gatus
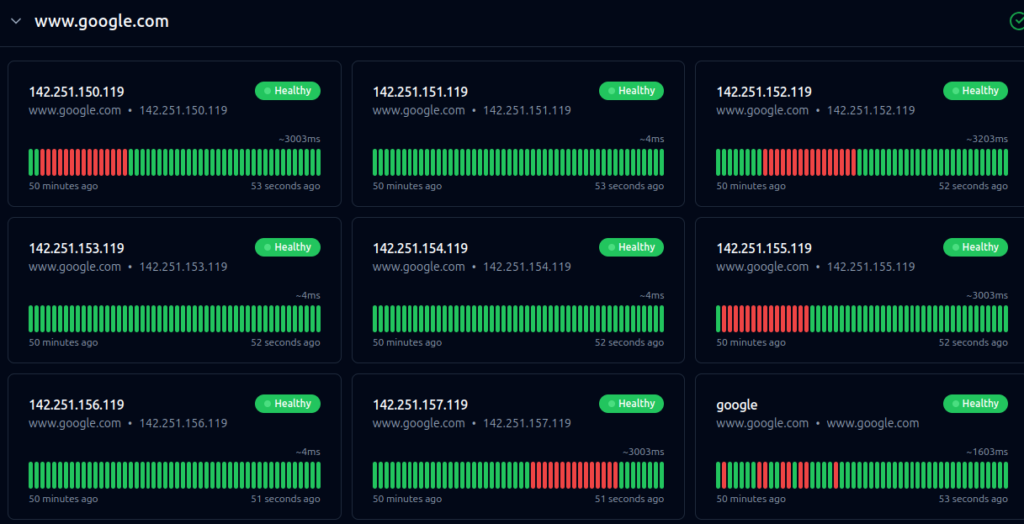
Gatus to the rescue! I don’t know much about their hosted service. I needed to monitor google from my location so I went with a local docker instance and boy, has it delivered! Here is a gist of the config I used to simply ping the 8 IP addresses every minute.
Is it still a plug if I praise someone else’s service? Who cares. I’m happy with the few features that I have used so far and I will most certainly be looking at it further. That feature list looks impressive!
Any conclusions?
What have I found out so far? Well, I’m not going (completely) mad. The red bars do exist but that’s as far as the insight goes for now.
- They last a VERY consistent 15 minutes
- They don’t seem to be random. Sometimes it’s all fine for a couple of days, sometimes they happen multiple times a day.
- The outages by IP, seem to be (loosely) connected. Quiet days are quiet across the board. On busy days the outages seem to happen in sequence.
If it was any other website or service, I would argue that their service rollout process is to blame, or their network update process, or their failover process or something along these lines.
We are talking about google services however. That’s the part that does not compute. It’s not that they don’t have youngsters that very enthusiastically push the wrong button. It’s that if a technician has beans in the evening, the news reports “excessive methane levels in the data centre” the next day. It could be my ISP but then it would be the national news instead…
That leaves 2 options. Either the issue is indeed on the side of my ISP but only affects a small subset of users, my network “neighbours” so to speak, or the issue is in my own network.
More data is required and more may soon be coming. I’ve asked the question on my ISP’s community forum and people have already offered to monitor from their own connections. There will probably be a 2nd part to this with further findings.
Alternate theory
There is of course a slight chance that they intentionally bury all the google outage reports from the search results. That means that yet another one of my conspiracy theories has been confirmed and this blog will never be popular now.
Anyone getting to find and read this entry constitutes and actual paradox and I need to stop writing and go find my tinfoil hat at once. So long and thanks for all the fish!